Geo Pricing Scheme
How It Works
Our geo pricing scheme is a pricing strategy that looks at the immediate for sale and sold comps around a specific property and uses those as the basis of the market value. If selected, we take the baseline county pricing as a starting point, and after exporting the property data we find the closest for sale and sold comps with similar acreages to the property. Then, using simple Machine Learning techniques, we adjust the pricing of each property based on the modeled price of the closest comps.
The Steps In Geo Pricing
Step 1: Locating the Property
The first step of our geo pricing process involves locating the property. This is the easiest step, as we simply extract the latitude and longitude from the owner record.
Note: We cannot geo price a property without the latitude and longitude.

Step 2: Locating the Nearest Comps
The next step of our process involves pinpointing the closest for sale and sold comps to the property. The goal is to find a balance of both, within an acceptable acreage range similar to that of the target property.

Step 3: Filtering for the correct comps
Before sending the nearby comps to our geo pricing model, we must first validate that they are not outlier properties. During this step, we run every comp through our statistical analysis engine to determine the pricing quality of the comp. The goal is to remove terms deals, overpriced land, or mislabeled vacant land that has a property on it.

Step 4: Extracting Nearest Comp Pricing
The fourth step of geo pricing is perhaps the most crucial, in that we now extract the comp price data, and along with the owner record data, feed it to our geo pricing model for calculation. In this step we also generate model weighting for factors such as whether a comp is sold or not, days on market for a for sale comp, and proximity to the target property.

Step 5: Update Owner record pricing and repeat
The final step is simply to take the model's outputted value for suggested market price, and apply that differential to our offer pricing. Once that's complete, we move on to the next record and repeat the process!
Help: How to read the Geo Pricing Output
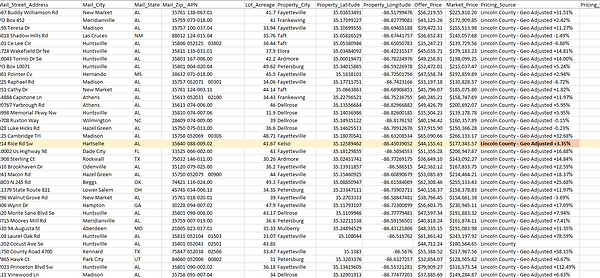
When looking at a row of property data, you will notice in the column labeled "Pricing Source" that there is a county or city name, followed by the text "Geo Adjusted X%". What this is saying is that we took the original county or city price/acre, and then based on the strategy above, adjusted it plus or minus X% to come up with the final market value. So in the highlighted example above, we took the Lincoln County market price/acre, and for this specific property, increased that value by 3.35%. This can be inferred as "compared to Lincoln County at this acreage, this property (and the immediate surrounding area) is 3.35% more expensive".
You may also notice some rows that only show a county or city name with no "Geo Adjusted" text. In these cases, we did not have enough data to come up with a valid geo pricing model, so we instead reverted the price back to the original county or city price/acre. We offer a feature called Split Pricing that helps identify these properties.
Help: How to revert the Geo Pricing back to county/city pricing
What happens if you see the geo pricing numbers and you'd like to manually revert to the original price? It's very easy, as all of the needed numbers are in your final list!
Copy and paste the below formula into a new column, replacing the following variables:
X = Offer Price Cell
Y = Pricing Source Cell
=X/(1+ VALUE(RIGHT(Y,LEN(Y) - MIN(SEARCH({0,1,2,3,4,5,6,7,8,9}, Y&"0123456789")) +2)))